
We want that you make real money with the cryptocurrency market, but we want you to do it calmly and in the way that the big players do.
How do they do? Very simple, they take some good beers while playing poker, they bet on the best card with a well-planned strategy, and then they wait with great patience and confidence.
For that reason, in the following multidimensional analysis, we want you to know how far we really believe that the price of Litecoin will go in the short, medium, and long term.
Asset That Needs Patience
By the time this article was written, Litecoin was breaking the resistance zone of 214 and 228; and looking to test the 243 in a dominant move in W.
Just as Bitcoin was created as an alternative to partial gold substitution, Litecoin can be demonized as the viable alternative to silver. This suggests a high correlation between one asset and another, which allows us to recognize a good source to place our money without risk.
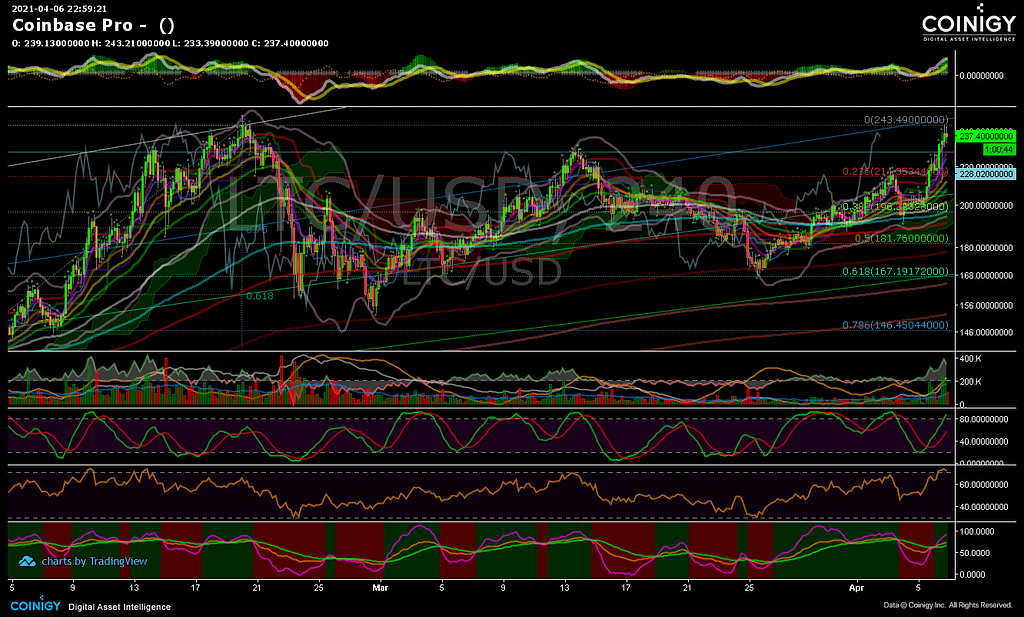
Many may have already realized that with the Ethereum network’s high feeds, various cryptocurrency fans are using other currencies to transact. In that order of idea, Binance Chain and Litecoin are being the best cheaper alternatives in those days.
The latter is summarized in a great interest of utility and greater volume of negotiations. A fact that we can significantly notice in some of the indicators, but that we must significantly emphasize something: Litecoin needs a lot, a lot of patience.
Strong Correlation
Our premium subscribers are already knowing that Bitcoin in their daily trades is in an ABCDE accumulation phase and under a high correlation with Bitcoin.
We also see a typical movement in W that is making a price push towards the break of the resistance at 236 and a possible touch of the diagonal resistance of Gann at 269.
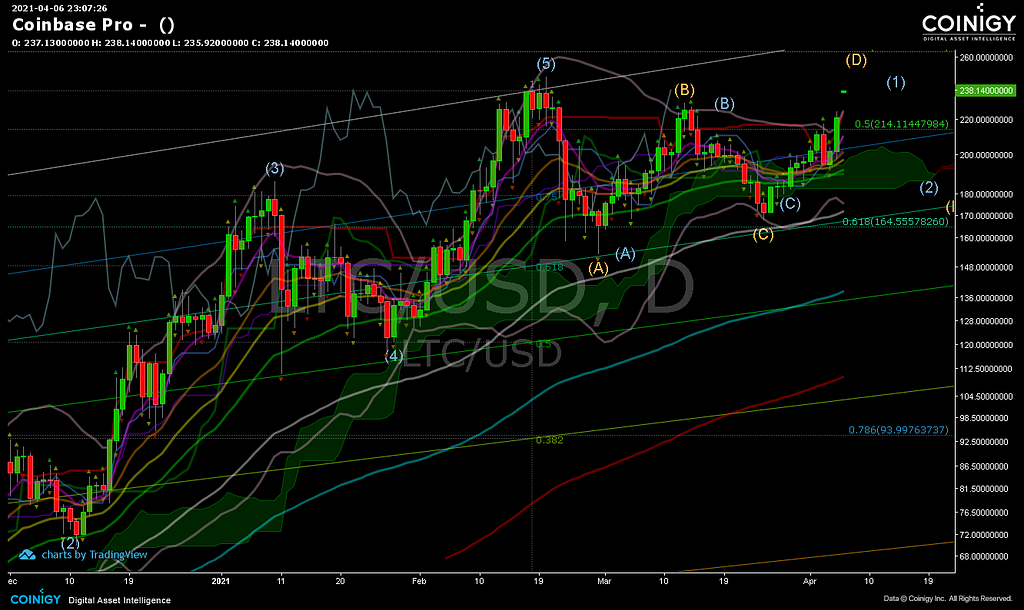
Up to that point, we can confirm wave D, but if there is a high break in that area, we can start the cycle of waves 12345, and that can push the price towards 324.
On the indicators side, we see a high correlation towards the continuation trend, with a strong interporality index. It really is true, Litecoin is a slow asset, less volatile but much safer.
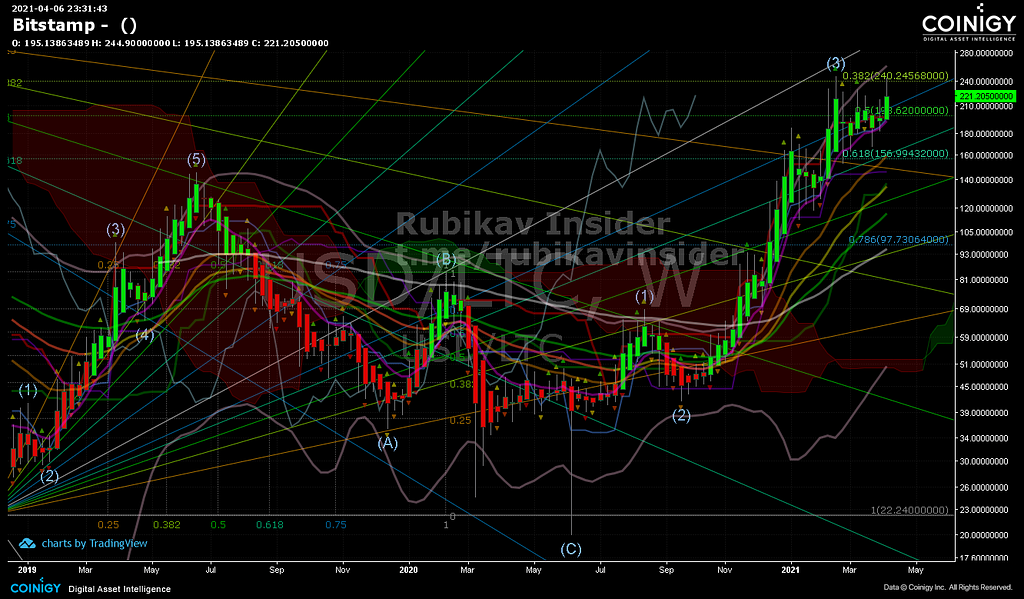
The Wave For surfing
Over the past few years, we have learned that to make good profits it is necessary to understand how to ride the waves.
The weekly chart of Litecoin suggests that we should still trust wave that is underway, and as many will know, it is an impulse wave 3 that we believe will take the price of 238 until the break of the all-time high of 375. For this reason, what will make you earn money here will be the patience factor.
We really don’t want to offer you re-copied trade signals. We want to give you good confirmations so that you can have the best and highest possible result. Where we go?
If you are very observant, you will see that we are always sending those currencies that we have analyzed with the main theories of technical analysis. Among them, Elliot is the strongest.
For that reason, we don’t literally send you “potato chips”; we send you a good dose of black wine. The same one that tells you right now that Litecoin is in a sea full of high whales wanting to invest. Quite a paradox, don’t you think?
Keep Us A Secret
We will give you a secret, but we want you to keep it very well. The cryptocurrency trade is not about making minute-by-minute operations, it is about building a good long-term investment portfolio and with which you obtain good results without having to sweat a drop of cold.
You may have already noticed that many sell you the idea of a big pump without looking relatively to the future and worst of all, without recognizing what the indicators are talking about in the present.
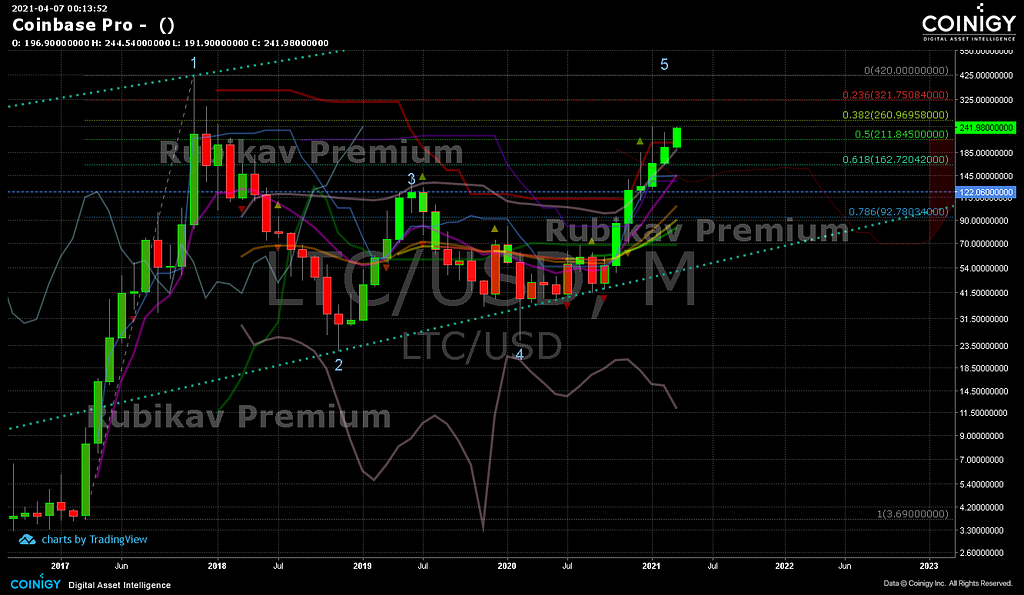
That present and that future, and based on what the monthly graph of Litecoin shows us, they say that this asset is almost in the terminal phase of wave 5 and that we could accumulate from the prices of 211 to 260 (fibo gold resistance line) for long-term gains up to 420; with an appreciation of more than 80% in the long term.
Many experienced traders will tell you that the breaking of the 0.6 fibo gold resistance line, and within a wave 5, is worth more than the crossing of the EMA50 and the EMA300 or golden cross. We agree with that.
Litecoin, after crossing that critical line, will activate many alarms in the coming months. But it will also make many traders cry who still believe that copy trade, it works.
Indicators such as the break of the 70 points of the RSI; a favorable move in W; parabolic movement in the MACD; and trend following through ATR and ADX with positive direction make these last parameters an impulse so that the next alarms within this asset are triggered with ease. Good Luck!
Read this story on https://rubikkav.com/.
Join to us on Telegram here https://t.me/rubikkavcommunity.
Check out our new platform 👉 https://thecapital.io/
https://twitter.com/thecapital_io
https://medium.com/media/3b6b127891c5c8711ad105e61d6cc81f/href
Where Is The Price Going Up? Multidimensional Litecoin Technical Premium Analysis was originally published in The Capital on Medium, where people are continuing the conversation by highlighting and responding to this story.