Ethereum price is struggling below the $3,400 resistance against the US Dollar.
ETH price is now trading below $3,320 and the 55 simple moving average (4 hours).
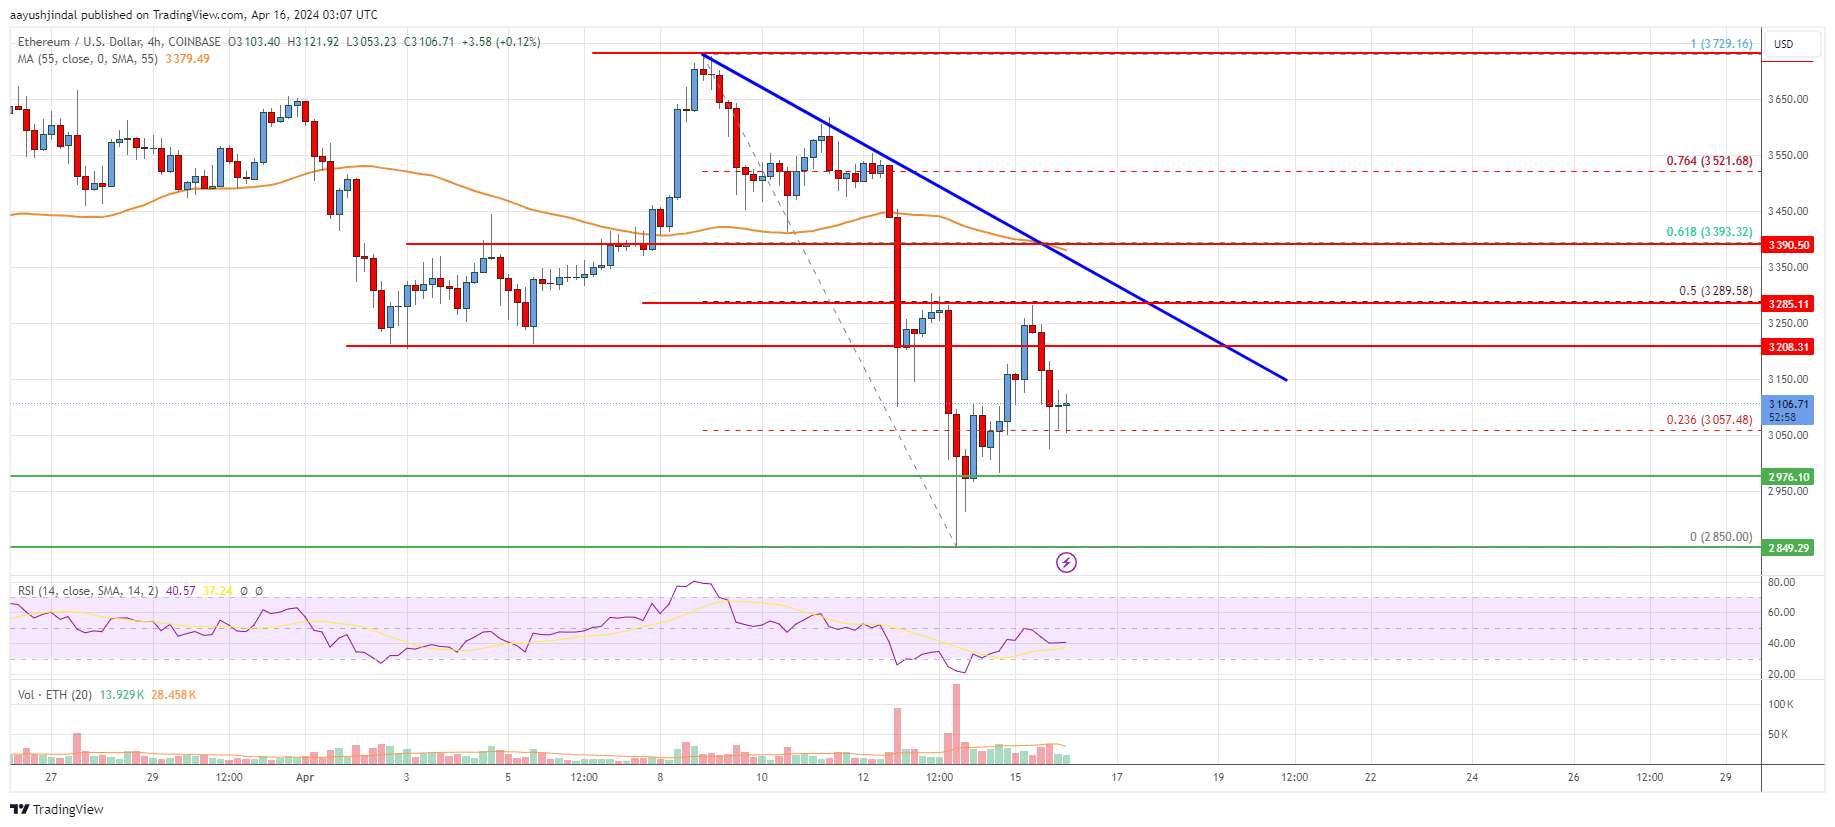
There is a key bearish trend line forming with resistance near $3,200 on the 4-hour chart (data feed from Coinbase).
The pair could continue to move down if it stays below $3,200 and $3,320.
Ethereum price is declining below $3,400 against the US Dollar. ETH/USD remains at a risk of more downsides if it fails to recover above $3,320.
Ethereum Price Analysis
This past week, Ethereum struggled to stay above the $3,500 level against the US Dollar. ETH price started a fresh decline and traded below the $3,400 pivot level.
It traded below $3,320 and $3,200 support levels to enter a bearish zone. There was also a break below the $3,000 level. A low is formed near $2,850 and the price is now correcting losses. ETH is now trading below $3,320 and the 55 simple moving average (4 hours).
There is also a key bearish trend line forming with resistance near $3,200 on the 4-hour chart. The trend line is near the 50% Fib retracement level of the downward move from the $3,729 swing high to the $2,850 low.
On the upside, the price is now facing resistance near the $3,200 level and the trend line. The next major resistance is near the $3,320 level. The main resistance is now forming near the $3,400 level. It is close to the 61.8% Fib retracement level of the downward move from the $3,729 swing high to the $2,850 low, above which the price could test the $3,550 resistance.
A clear move above the $3,550 resistance could send the price toward $3,750. On the downside, initial support is near the $3,050 level. The next major support is now near the $2,980 level. A break below the $2,980 support could push the price to $2,850. If the bulls fail to protect the $2,850 support, the price might decline toward $2,550.
Looking at the chart, Ethereum price is trading below $3,320 and the 55 simple moving average (4 hours). Overall, Ether’s price could continue to move down if it stays below $3,200 and $3,320.
Technical indicators
4 hours MACD – The MACD for ETH/USD is now gaining momentum in the bearish zone.
4 hours RSI (Relative Strength Index) – The RSI for ETH/USD is now below the 50 level.
Key Support Levels – $3,050, followed by the $2,850 zone.
Key Resistance$ Levels – $3,200 and $3,320.
The post Ethereum Price Analysis: ETH Revisits Support As Bears Take Control appeared first on Live Bitcoin News.